Not-So-Fishy Fish Choices : A Chart for Mercury and PCB levels for Common Fish
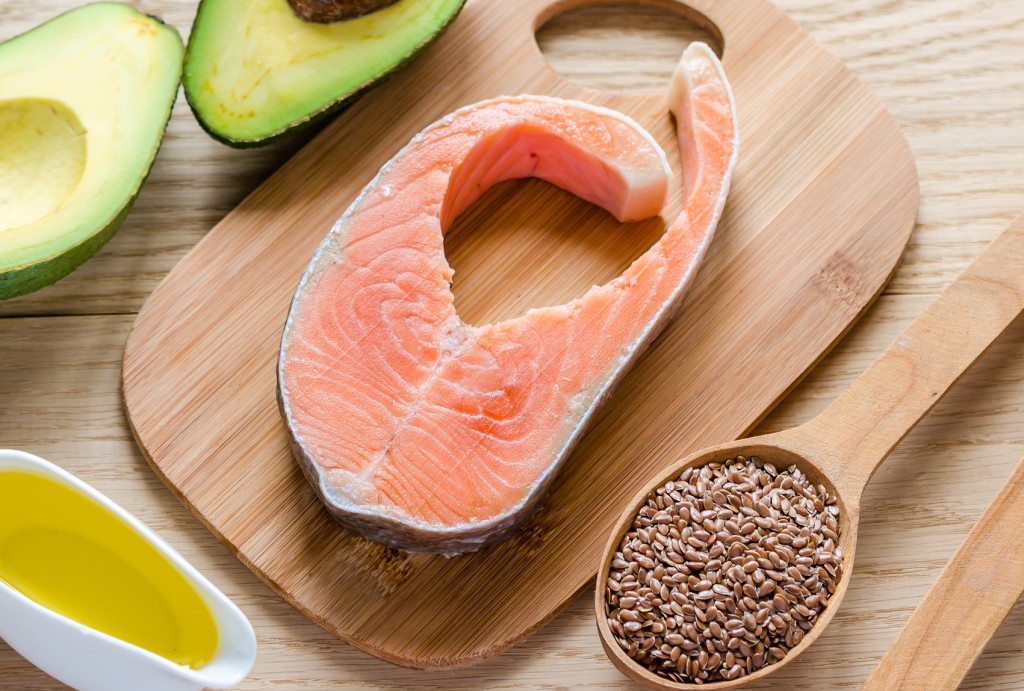
This is a reference table to help us choose fish that has the highest Omega 3 fatty acids, along with the lowest toxic contaminants.
Looks like the winners are Anchovy, Herring, Mackerel and Wild salmons.
Omega-3 fatty acids and industrial contaminants in commonly eaten fish and shellfish.
| Type | EPA + DHA (mg/serving) (oz) | EPA + DHA (mg/100 g) (3.5 oz) | Mercury (µg/g) (ppm) | PCBs (ng/g) (ppb) |
| Anchovy | 1165 (2) | 2055 | < 0.05 | |
| Catfish, farmed | 253 (5) | 117 | < 0.05 | < 50 |
| Cod, Atlantic | 284 (6.3) | 158 | 0.10 | |
| Fish burger (fast food) | 337 (2.2) | 546 | < 0.05 | 8 |
| Fish sticks, frozen | 193 (3.2) | 214 | < 0.05 | |
| Halibut | 740 (5.6) | 465 | 0.25 | |
| Herring, Atlantic | 1712 (3) | 2014 | < 0.05 | |
| Mackerel, Atlantic | 1059 (3.1) | 1203 | 0.05 | |
| Mackerel, King | 618 (5.4) | 401 | 0.73 | |
| Mahimahi | 221 (5.6) | 139 | 0.15 | |
| Pollock, Alaskan | 281 (2.1) | 468 | < 0.05 | |
| Salmon, farmed | 4504 (6) | 2648 | < 0.05 | 15–51 |
| Salmon, wild | 1774 (6) | 1043 | < 0.05 | 0.5–5 |
| Sardines | 556 (2) | 982 | < 0.05 | 22–57 |
| Shark | 583 (3) | 689 | 0.99 | |
| Snapper | 546 (6) | 321 | 0.19 | |
| Swordfish | 868 (3.7) | 819 | 0.98 | |
| Trout | 581 (2.2) | 935 | 0.07 | 11 |
| Tuna (light/skipjack) | 228 (3) | 270 | 0.12 | 45 |
| Tuna (white/albacore) | 733 (3) | 862 | 0.35 | 100 |
| Clams | 241 (3) | 284 | < 0.05 | 2–3 |
| Crab | 351 (3) | 413 | 0.09 | 6 |
| Lobster | 71 (3) | 84 | 0.31 | |
| Mussels | 665 (3) | 782 | < 0.15 | 0.8–7 |
| Oysters | 585 (3) | 688 | < 0.05 | 0.8–17 |
| Scallops | 310 (3) | 365 | < 0.05 | |
| Shrimp | 267 (3) | 315 | < 0.05 | 0.2–2 |
DHA: Docosahexaenoic acid; EPA: Eicosapentaenoic acid; PCB: Polychlorinated biphenyls; ppb: Parts per billion; ppm: Parts per million.
Reference: Mozaffarian D, Rimm EB. Fish intake, contaminants, and human health: evaluating the risks and the benefits. JAMA296(15), 1885–1899 (2006).


